Learn about EC Mapping and the CGS Farm A.D.E. Program
Join us for a quick conversation about our Farm A.D.E. Program
Free30 min

Farm A.D.E. Program: Faster Insights. Better Returns
The goal is not simply to generate lab numbers.
The goal is to create a field-by-field learning system that improves your crop planning over time.
Our Farm A.D.E. Program helps you:
1. Measure variability
Using EC mapping, yield layers, EVI imagery, and field history, we identify where meaningful variability exists.
2. Diagnose soil function
We benchmark chemistry, biology, and physical performance so we know what is really limiting productivity.
3. Build learning blocks
We use controls and multiple rates to generate real on-farm answers instead of assumptions.
4. Create better prescriptions
We build variable-rate recommendations for more than just nitrogen, based on what your field is showing us.
5. Validate products and practices
We recommend only what proves its value in your soil, your crop rotation, and your management system.
Zone Sampling and Soil Mapping
Zone mapping is strongly recommended, give us a call to discuss your options. Ask us how we can get you up to $20,000 towards our mapping service, and up to $10,000 off our soil sampling service. Conditions Apply.
When available, we use:
EC mapping
Harmonized yield data
EVI imagery from peak season
Field history and observations
This helps identify high-performing and low-performing areas so testing can be placed where it reveals something useful. In many cases, this means 2 to 4 tests per field, depending on the number of meaningful zones.
CGS Soil Mapping Service — $5 to $9 per acre
One-time fee based on total acres.
CGS Sample Collection Service — $1.00 to $2.00 per acre
Depends on total acres and travel time.
All samples are subject to GST and exclude shipping fees.
What’s included in the 0–6" CGS Benchmark Analysis - $155 /sample
Electrochemical Parameters & Balance Ratios
Soil pH, Buffer pH, Soil Electrical Conductivity (EC), Cation Exchange Capacity (CEC), Percent Saturation of Cations, Sodium Adsorption Ratio, and K:Mg ratio, P:Zn ratio, %P Sat (if acidic).
Bio-physicochemical Parameters
Soil Texture (% sand, silt, clay), Organic Matter %, Soil Redox Potential, Microbial Respiration, Water Holding Capacity %, Soil Bulk Density, Aggregate Stability, Total Organic Carbon, Humic Acid, Fulvic Acid, ACE Soil Protein, Reactive Carbon, Active C:N Ratio.
Available Nutrients
Nitrate, Ammonium, Estimated Organic Nitrogen Release (ENR), Kelowna Phosphorus, Calcium, Magnesium, Sulphur, Zinc, Manganese, Iron, Copper, Boron, Chloride, Molybdenum, and Silicon.
Total Nutrients (Complete Acid Digest)
Phosphorus, Potassium, Magnesium, Calcium, Sulfur, Iron, Manganese, Copper, Zinc, Boron, Molybdenum, Chloride, Sodium, and Aluminum.
What’s included in the Routine 0–6" Profile- $75 /sample
Powered by the Vitellus Soil Health test from A&L Labs Canada

Electrochemical Parameters & Balance Ratios
Organic matter (OM), pH, buffer pH (BpH), Electrical Conductivity (EC), K:Mg ratio, %P, %Al,
Available Nutrients
Nitrate Nitrogen, PMN (Potential Mineralizable Nitrogen), Phosphorus (P), Potassium (K), Magnesium (Mg), Calcium (Ca), Sodium (Na), Sulphur (S), Boron (B), Copper (Cu), Manganese (Mn), Iron (Fe), Zinc (Zn), Aluminum (Al), chloride (Cl),
Physicochemical Parameters
Cation Exchange Capacity (CEC), Percent Saturation of Cations,
Soil Health Parameters
Microbial Respiration, Active Carbon, Soil Health Index.
Optional Service Pricing
What’s included in the 6–12", or 6- 24" Profile- $65 /sample
Electrochemical Parameters
Soil pH, Buffer pH, Soil Electrical Conductivity (EC), Soil Texture, Organic Matter %, Cation Exchange Capacity (CEC), Percent Saturation of Cations, Sodium Adsorption Ratio (SAR), and K:Mg ratio.
Available Nutrients
Nitrate, Ammonium, Kelowna Phosphorus, Calcium, Magnesium, Sulphur, Boron, Chloride, Aluminum.
What's Included in the Whole Plant Dry Tissue Analysis (Report Card) — $75 /sample
We use whole plant dry tissue analysis to compare what the plant is actually taking up against what the soil is expected to supply.
Total Nutrients
Total Nitrogen, Phosphorus, Potassium, Calcium, Magnesium, Sulphur, Zinc, Manganese, Iron, Copper, Boron, Chloride, Molybdenum, and Silicon.
Antagonistic Ratios
N:S, P:Zn, K:Mg, K:Ca, Ca:Mg, K:(Ca+Mg), Ca:B, Fe:Mn, and Zn:Cu.
For Peas and Lentils we include Mo:N and Mo:S
Compaction Readings
Compaction readings are strongly recommended for the most accurate interpretation, but they are not required to get started.
If you have a soil penetrometer, you can take your own readings during the season and include the average of at least 5 readings per zone. Ideally, record both the 200 PSI and 300 PSI depths from each sample location. It is ESSENTIAL to take reading at field capacity. Meaning when soils are moist.
Eyes Wide Open Guarantee
Before any work begins, we provide a clear estimate based on your number of fields and distance from the nearest consultant, so you understand the expected cost up front.
Give Us a Call
Stop making expensive decisions with weak data.
Benchmark your soils properly. Monitor them routinely. Learn faster with every acre.
Contact Crop Growth Sciences to book your benchmark analysis, routine maintenance testing, mapping, or sample collection.
CGS Farm A.D.E. is Powered by FieldAlytics

Stop Guessing with Your Crop Plan
Tight margins leave no room for bad assumptions.
With operating margins as tight as they are today, guessing is too risky.
FieldAlytics, developed by Ever.Ag, is a comprehensive digital agronomy platform designed to unify field data, logistics, and planning into a single, cloud-based ecosystem. For farmers, the primary benefit lies in its ability to transform raw data—such as EC field maps, soil samples, yield maps, and satellite imagery—into actionable intelligence for more precise decision-making. Through its integrated tools, farmers can collaborate more effectively with their agronomists to create variable-rate prescriptions for seed and fertilizer, optimizing input costs while maximizing yield potential. The software also streamlines daily operations by providing real-time weather tracking, automated record-keeping for compliance, and a mobile dashboard that allows growers to monitor work orders and equipment progress from anywhere. By centralizing these complex workflows, FieldAlytics helps farmers move away from scattered spreadsheets and toward a more efficient, data-driven approach to sustainable crop management.
When you work with CGS, access to this platform is included at no additional cost.

Bad data, incomplete data, or messy data can cost you the most important thing on the farm: time. And as farmers, we do not get unlimited chances. A season lost to poor decisions is not easily won back.
At Crop Growth Sciences, we help you learn faster—without gambling seasons—by turning every field into a measurable system.
Through our Farm A.D.E. Program — Agronomic Development Engine — we help growers:
map field variability properly
diagnose soil function, not just fertility levels
run learning blocks with a control and multiple rates
build variable-rate prescriptions for more than just nitrogen
validate which products and practices actually pay in your soil and rotation
Then we recommend only the products and practices that prove their value in your system.
Benchmark first. Maintain routinely.
Not every soil test should be treated the same.
Our Comprehensive Benchmark Analysis is designed for onboarding and first-time diagnosis. This is the exhaustive analysis used to establish your baseline and understand how your field is functioning at depth and across zones. We only revisit this every 3-5 years depending as structural changes take time to evolve and repair.
After that, growers move into a Routine Maintenance Soil Test to monitor progress, develop annual fertility plans, confirm trends, and make sharper decisions at a lower cost.
Why this matters
If your sample strategy is weak, your conclusions will be weak.
Randomized or grid sampling often creates noise instead of insight. We prefer to help growers sample in a way that actually teaches us something. That means identifying meaningful variability first, then placing tests where they can explain performance differences and guide decisions with confidence.
Because if we are not learning, we are just spending.
Soil Testing Recommendations
0–6" Comprehensive Benchmark Analysis
This is our full onboarding test and the foundation of the Farm A.D.E. process.
It is designed to establish a true benchmark for:
nutrient availability
soil function
biological activity
physical structure
variability between zones
future prescription development
Use this test first when entering the program, benchmarking a new field, or resetting your management approach after major changes. We only need to repeat this test every 3-5 years.
Routine Maintenance Soil Test
Once a benchmark has been established, routine maintenance testing gives you a practical way to continue measuring performance without repeating the full onboarding package every time.
This option is ideal for:
annual monitoring
checking whether management changes are working
validating fertility direction
keeping decisions grounded in real field data
avoiding overreaction to guesswork or visual assumptions
Optional At-Depth Testing (but recommended)
6–12" or 6-24"" Profile — $65/test
Used to better understand nutrient movement, rooting environment and risks, and sub-surface conditions below the main topsoil layer.
Plant Tissue Test: Our Report Card
This report looks at nutrient ratios inside the plant to show how the crop was actually feeding at that point in the season. These ratios help reveal whether the crop was short on key nutrients, taking up too much of one compared to another, or dealing with nutrient tie-up and competition that likely started in the root zone. In plain terms, this is your crop’s report card on how the soil and fertility program performed in the field.
Key ratios included in the report
Nitrogen to Sulfur (N:S)
Shows whether sulfur is keeping up with nitrogen. When this ratio runs too wide, the crop may have enough nitrogen on paper but not enough sulfur to fully use it.
Phosphorus to Zinc (P:Zn)
Helps show whether phosphorus is running too high compared to zinc. This can be a sign that zinc was harder for the plant to access or was being tied up.
Potassium to Magnesium (K:Mg)
Shows whether potassium may be crowding out magnesium uptake. This is one of the most useful ratios for spotting nutrient competition.
Potassium to Calcium (K:Ca)
Helps show whether high potassium may be limiting calcium uptake or movement in the plant.
Calcium to Magnesium (Ca:Mg)
Gives a picture of balance between these two major structural nutrients and helps show whether one may be dominating the other.
Potassium to Calcium + Magnesium [K:(Ca+Mg)]
A broader balance check that helps show whether potassium is overpowering the plant’s uptake of calcium and magnesium together.
Secondary ratios we include
Calcium to Boron (Ca:B)
Helps show whether boron is keeping up with plant growth, structure, and reproductive demand.
Iron to Manganese (Fe:Mn)
Can help explain stress tied to soil pH, wet conditions, or restricted micronutrient uptake.
Zinc to Copper (Zn:Cu)
A supporting ratio that can help flag micronutrient imbalance or competition.
For lentils, peas, and other legumes
Molybdenum to Nitrogen (Mo:N)
This is one of the main molybdenum ratios we look at in legumes. Molybdenum plays an important role in nitrogen fixation and helps the plant turn nitrogen into usable protein. When Mo runs too low relative to N, it can be a sign that the crop’s nitrogen-fixation system was not working as well as it should.
Molybdenum to Sulfur (Mo:S)
This ratio helps show whether molybdenum may have been lagging behind sulfur in the plant. It is a useful way to assess whether the legume had the trace nutrient support needed for strong nodulation and efficient nitrogen use.
Why we Look at These Ratios
These ratios do more than list nutrient levels. They help explain how the crop was responding to the soil, the fertility program, and the growing conditions that season. That gives you a clearer picture of where nutrition was working, where it was falling short, and what needs to be improved next time. It is a practical way to move from guesswork to evidence and build a stronger crop nutrition program year over year.

Samples taken at 0 -2", 2 - 4", and 4 - 6"
Soil has variability in No-Till Soils at depth as well.
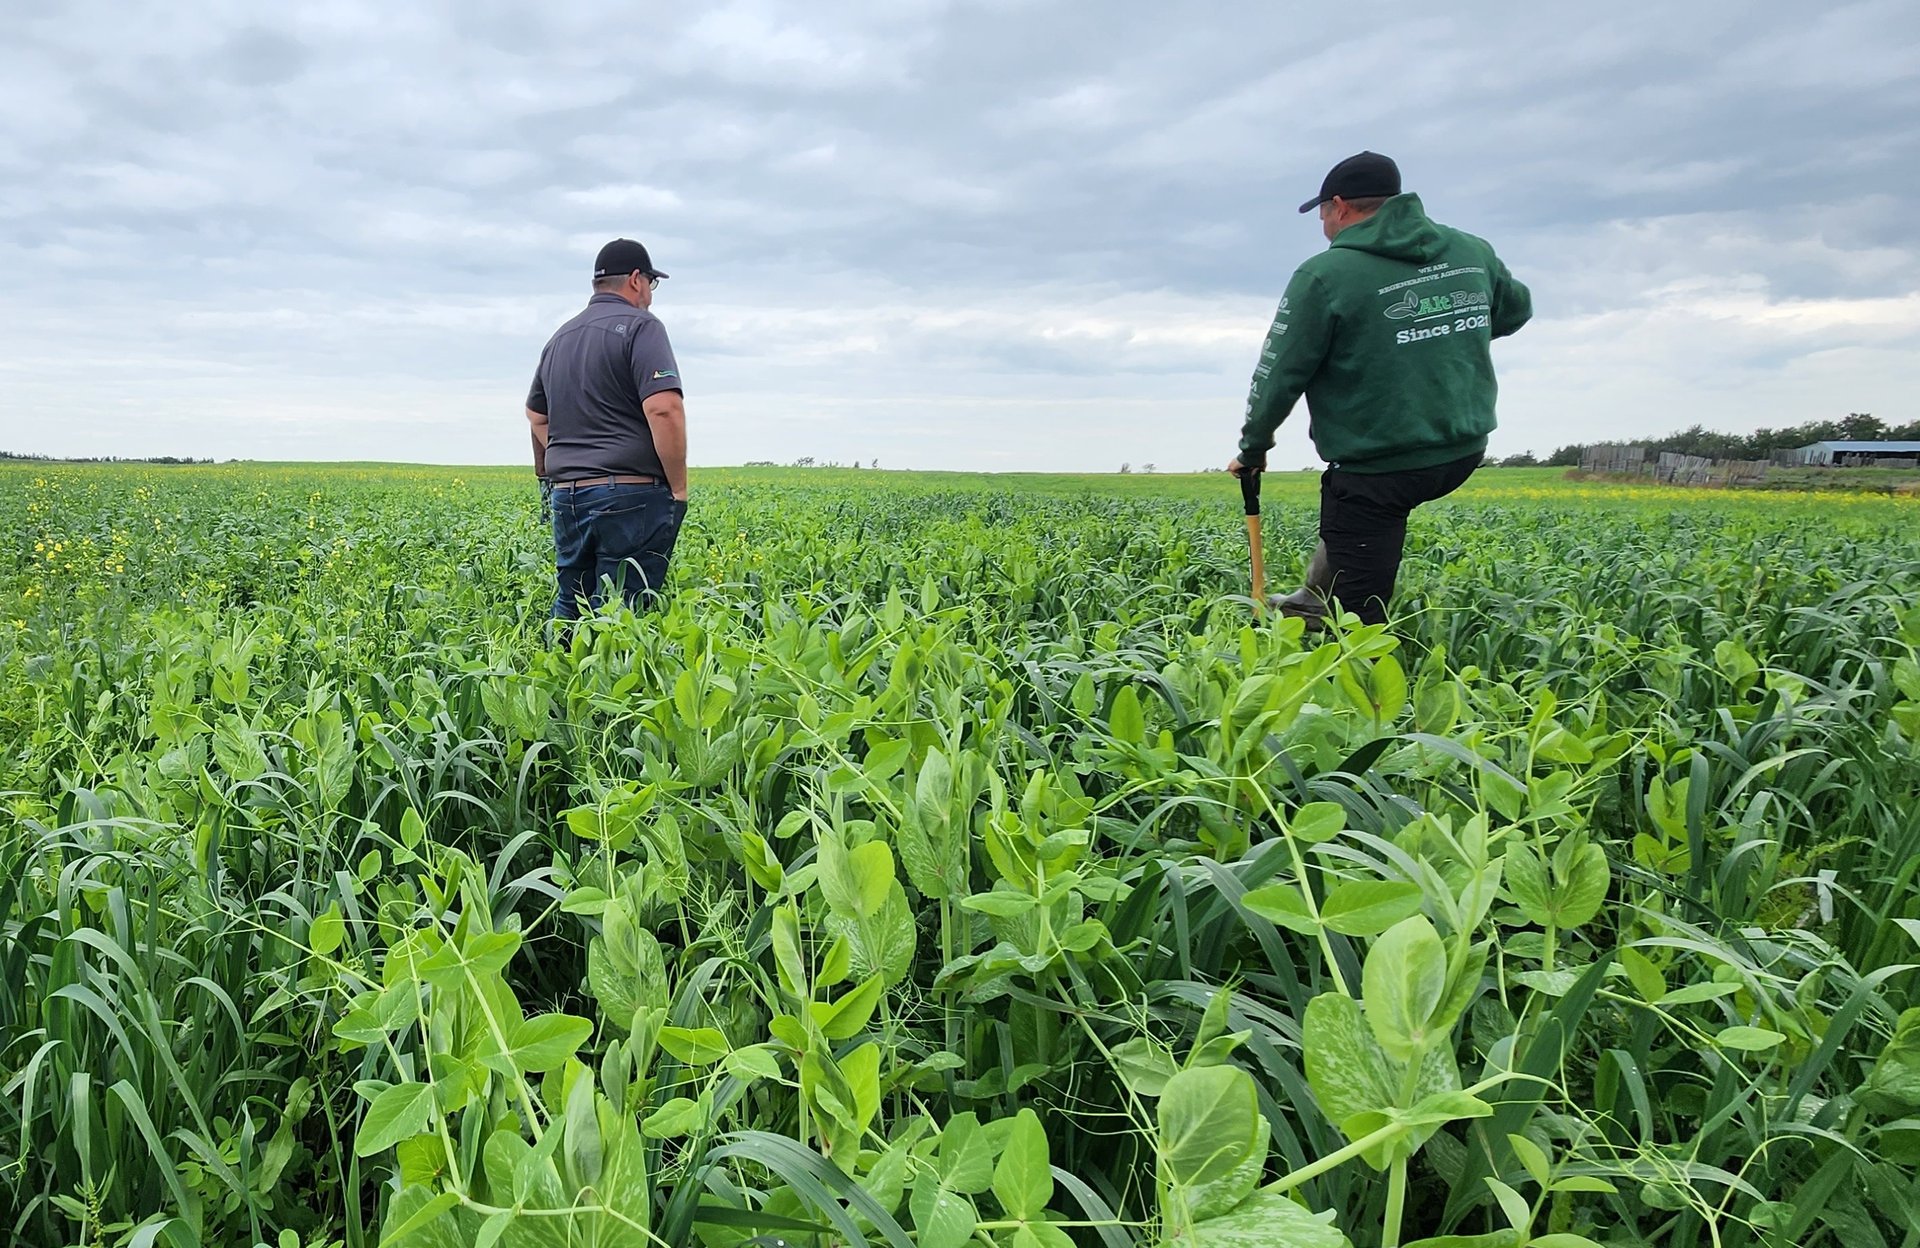
Real-World Variability Exists in Nearly Every Acre We Map
Across the 250,000+ acres now enrolled in the CGS FARM A.D.E. Program, one thing continues to show up again and again: field variability is everywhere.
Our mapping crews have been in constant demand, and no matter where we work across Saskatchewan and Alberta—regardless of region, soil zone, or microclimate—we consistently see significant productivity variation within fields.
That variability matters. Because if you do not account for it, your trial results can mislead you.

Random Trial Placement Creates Noise, Not Confidence
When trials are placed randomly—or worse, run as basic strip trials—the data often becomes clouded by underlying field variability.
The result is noisy, unreliable comparisons that make it difficult to separate actual product performance from differences in field productivity. That can waste time, distort decision-making, and cause you to dismiss a practice or product that may have delivered real value under the right conditions.

Better Trial Placement Creates True Apples-to-Apples Comparisons
This map shows the spatially contrasted, delineated zones built from the variability identified in the first image.
By organizing comparative trial blocks within matched productivity zones, we create cleaner, more trustworthy datasets. That means you can evaluate performance on a true apples-to-apples basis.
And in many cases, success is not just about choosing the right tool—it is about choosing the right rate. Economic response can easily be hidden when trials are randomized across uneven field conditions. Only zone-based comparisons, combined with flexible rate testing inside those zones, can reveal whether a product or practice will generate a real return on investment.
The CGS FARM A.D.E. Program is designed to help you make decisions with confidence—based on data you can trust.

Contact Us Today
When it comes to on-farm decisions, the cost of poor data is too high.
Book a face to face chat today to learn how the CGS FARM A.D.E. Program can help you generate cleaner trials, clearer answers, and more reliable ROI.
© 2026 Crop Growth Sciences CGS Ltd
Tools, Knowledge, Results
Don't be shy!
Give us a call or book an appointment to find out how we can help.
Sometimes it's just quicker talking human-to-human to get to the root of the matter
We always have 5 minutes!
Want more time?
We'd love to hear more about your challenges in greater detail. Easily connect with us on your schedule
We don't show our phone number due to the vast amount of spam bots scraping our number these days. Please click this button on your mobile device. It's toll free!
CGS is an Eco Health Industries and Soil Sense Innovation Collaboration